Discover which are the 10 most relevant ecommerce KPIs and how to analyze them more efficiently in your routine.
Amidst so many variables, keeping track of ecommerce KPIs becomes fundamental to assess the health and performance of the business.
But with a large amount of information, it remains unclear which of these metrics are truly essential and how to measure them practically and efficiently.
In this article, we will explore the 10 main performance indicators in ecommerce and understand how each one directly impacts sales, conversions, and customer experience.
Furthermore, we will see how Reportei, which integrates with Woocommerce, Shopify, and Nuvemshop, can simplify and expedite tracking all this data. Let’s go!
Key ecommerce KPIs you should track
When discussing ecommerce KPIs, we refer to metrics that show whether your online store is on the right track or if adjustments need to be made to improve your results.
Thus, the choice of the right indicators may vary according to the type of business and the goals set.
However, there is a set of key metrics that are usually relevant for most e-commerce sites. Let’s look at 10 of them below.
1. Revenue: one of the main ecommerce KPIs
To start, revenue represents the sum total of revenue generated by sales in your online store over a given period.
Thus, it is an essential indicator for understanding the real dimension of your business and assessing if your marketing strategies and sales are bringing satisfactory financial results.
Periodic analysis of this indicator also helps identify expansion opportunities as well as the need to review prices or operational costs.
2. Conversion rate
The conversion rate is one of the most important ecommerce KPIs as it reveals the ratio of visitors who actually make purchases in your store.
In other words, it shows whether the marketing efforts and site usability are working. A low rate may indicate problems in the customer journey, lack of clarity in product information, or barriers in the checkout process.
To calculate it, simply divide the number of purchases by the total number of visitors over a given period and multiply by 100.
Additionally, if you wish to increase the conversion rate, it is crucial to:
- optimize product pages
- offer social proof such as testimonials and reviews from other customers,
- make the cart and checkout simpler,
- and conduct A/B tests for pages and offers to understand what works best.
3. Average ticket
Meanwhile, the average ticket represents the average amount customers spend on each purchase. To find it, simply divide the total sales value by the total number of orders over a period.
Thus, the indicator reflects the ecommerce’s ability to sell higher-margin products or to encourage customers to buy more items.
To improve this result, you can invest in upsell and cross-sell strategies, offer free shipping above a certain value, or create product bundles within the ecommerce.
4. Customer Acquisition Cost (CAC)
The CAC is an indicator that shows the average cost of acquiring a new customer. Thus, its calculation includes all marketing and sales investments to attract these consumers, as shown in the following formula:
CAC = Total Sales & Marketing Expenses ÷ Number of New Customers Acquired
Understanding the cost of acquiring new customers is fundamental to the financial health of ecommerce. After all, if the CAC is too high, it can seriously compromise profitability.
Therefore, always try to optimize campaigns, better segment the audience, and invest in more efficient marketing channels to reduce customer acquisition costs and improve your results.
5. Return on Investment (ROI)
Along with CAC, the ROI is one of the ecommerce KPIs that evaluate the effectiveness of strategies and marketing actions in terms of financial return.
In other words, it shows how much you earned in relation to what you spent. Check out its formula:
ROI=Investment CostNet Profit×100
Based on the result, it indicates whether the actions are working or if it’s time to seek new paths. Additionally, it is essential for comparing different campaigns and marketing channels.
To ensure a ROI positive ROI, it is important to closely monitor each campaign, conduct constant tests, and allocate the budget to the channels that bring the greatest return.
6. Cart abandonment rate
This indicator shows the percentage of users who added products to the cart but did not complete the purchase. To calculate it, just divide the number of abandoned carts by the total number of carts created and multiply by 100.
Understanding this data is essential since cart abandonment is one of the biggest challenges in ecommerce as it indicates a lost sales opportunity.
To reverse a high rate, you can simplify the checkout process, offer multiple payment options, highlight shipping and delivery times, or send cart recovery emails.
7. Purchase frequency
Another among the most relevant ecommerce KPIs is the purchase frequency, which measures how often, on average, a customer returns to buy from the store within a period.
Increasing purchase frequency can be more profitable than acquiring new consumers because loyal customers tend to buy more and also refer the store to others.
That said, loyalty programs, exclusive discounts for repeat customers, and targeted marketing actions can help increase this number.
8. Refund or return rate
This rate indicates how many purchases resulted in a return or refund. Therefore, high results may signal issues with product quality, description, or even the delivery experience.
Thus, to reduce returns and consequently associated costs, you should work with accurate descriptions, high-quality photos, clear exchange policies, and have good logistical control in your store.
9. Net Promoter Score (NPS)
The NPS measures customer satisfaction and the likelihood of them recommending your ecommerce to others. As a result, buyers are categorized into promoters, neutrals, and detractors.
In other words, a positive experience reflects in promoters of your business, driving repeat sales and word-of-mouth marketing.
Therefore, investing in quality support, seeking constant feedback, and quickly resolving issues are ways to elevate your NPS.
10. Click-Through Rate (CTR) in campaigns
Finally, for stores that invest in ads and email marketing, monitoring the CTR Click-Through Rate is essential for understanding if the campaigns truly attract public interest..
After all, a high CTR indicates that the message, offer, or layout captures user attention. Conversely, a low result indicates the need for communication adjustments.
In fact, some improvements are associated with optimizing titles, CTAs, targeting ads to the right audience, and creating more relevant content.
How to analyze ecommerce KPIs effectively?
Knowing which ecommerce indicators to track is just the first step. How you analyze these data and transform insights into actions really determines if your business will succeed.
Thus, below are some tips for more effective analysis.
- Before you start monitoring any indicator, ask yourself what is the objective? Increase sales? Reduce costs? Improve customer satisfaction? The answer will guide the choice of the most relevant KPIs and how to track them.
- Evaluating numbers in isolation can be misleading. Therefore, compare KPIs over different periods – weeks, months, quarters – to identify trends and seasonalities, understanding whether your business is growing or not.
- Having clear goals based on historical analyses and market trends helps direct the team and align expectations. Goals that are too high can demotivate the team, while goals that are too low may not lead to significant improvements.
- Use analysis tools to centralize and interpret data in an integrated manner.
- Prioritize the customer experience. When observing drops or results below expectations, try to understand if there are difficulties in the purchasing process or communication failures affecting usability.
Analyze your ecommerce KPIs with Reportei
As mentioned above, to track all these KPIs quickly and accurately, having the right tool makes all the difference. And that’s where Reportei.
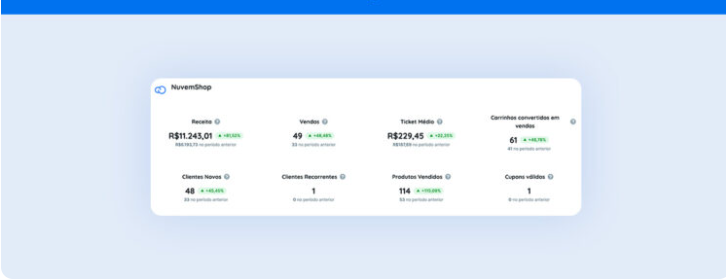
comes in. Our platform integrates directly with the main ecommerce tools in the market, such as Woocommerce, Shopify, and Nuvemshop, making it easier to analyze results and create reports. In addition, it provides:
- Simplified integration: you connect your store in a few clicks and gain immediate access to reports and dashboards that compile data from various sources in one place.
- Real-time dashboards: Reportei provides constant updates of the indicators, allowing you to make agile decisions to improve results.
- Intuitive visualization: graphs and reports are designed so managers and teams can quickly understand what’s happening, facilitating the identification of trends or problems.
- Simple sharing with the team: so everyone can align with objectives and goals and have a clear view of progress.
- Campaign performance measurement: in addition to integrating with ecommerce platforms, Reportei also connects to other digital marketing tools to provide a comprehensive view of investment in ads, social media, and more.
- Goal setting and alerts: to be notified when a KPI reaches critical levels or falls below expectations. This prevents unpleasant surprises and ensures that any problem is quickly identified and corrected.
Want to know more about how Reportei can leverage the analysis of your ecommerce KPIs? Visit our website right now and find out how to create comprehensive, integrated reports fully focused on growing your business.