Understand how the e-commerce dashboard works and discover the benefits it can deliver to improve your store’s operations and campaigns
In a market where every click can turn into profit or cart abandonment, having an e-commerce dashboard is the first step to gain clarity on your operations and act quickly.
After all, with this tool, you can turn key data into actionable insights and make real-time decisions, preventing small challenges from causing significant losses in your daily operations.
That’s why, below, we’ll explain how the e-commerce dashboard works and list the 10 benefits it can bring to your store’s operations. Follow along!
What is an e-commerce dashboard?
To begin understanding the importance of an e-commerce dashboard, it’s best to think of the tool as the control panel of your store.
In other words, instead of navigating through spreadsheets and scattered reports, it allows you to view everything happening on a single, clear, and interactive screen: visits to the website, completed sales, shipped orders, returns, and other situations.
From the data presented, the dashboard signals when everything is running smoothly or when something is out of the ordinary: a sharp drop in conversion, low stock, or delayed shipping.
In fact, just a few clicks are enough to filter dates, compare sales channels, or focus on a specific product.
The result is simplicity in the process: each team sees only what they need and quickly understands which decisions they need to make to keep the store healthy and the customers satisfied.
10 Benefits of the E-commerce Dashboard
Now that you know what an e-commerce dashboard is, it’s worth checking out the top 10 benefits of incorporating a dashboard into your store’s routine. Let’s go!
1. 360° View of the Business on the E-commerce Dashboard
First of all, a well-configured dashboard provides total integration of sales, marketing, and logistics, which generates a holistic view of the business.
In other words, it displays key KPIs of the business – such as conversion rate, average order value, ROI, average delivery time, and customer acquisition cost – all on a single screen.
It’s this 360° view that prevents isolated decisions, such as increasing traffic investments without checking stock capacity, and ensures that every action is analyzed for its impact on the store’s overall results.
2. Quick Identification of Problems in the Conversion Funnel
Since the e-commerce dashboard is designed to bring together data from different sources, it helps quickly identify various issues, such as product pages with a high bounce rate or checkout errors related to payment.
By detecting bottlenecks in minutes, rather than days, you can recover sales that would otherwise be lost, optimize the shopping experience, and reduce media costs by improving the conversion rate of existing traffic.
3. Operational Efficiency
By automating data collection and comparison, the dashboard eliminates hours of manual work and reduces human errors.
Moreover, the team can spend time on predictive analysis, renegotiating with suppliers, and A/B testing instead of formatting spreadsheets and copying numbers between tabs.
4. Continuous Optimization of Digital Marketing Campaigns
In addition, by cross-referencing paid traffic and sales data, the dashboard reveals in real-time which ads have a higher conversion rate and generate a lower CPA (Cost per Acquisition).
With this clarity, you can pause ineffective creatives, adjust bids, redefine targeting, and scale winning campaigns before competitors realize the opportunity.
5. Data-driven Inventory Management and Forecasting
Indicators related to inventory management and sales help avoid stockouts and excess stagnant inventory.
Additionally, minimum stock alerts allow for proactive restocking, while ABC curve analysis guides promotions for slow-moving items—freeing up working capital and reducing storage costs.
6. Customer Experience Analysis with the E-commerce Dashboard
Through the e-commerce dashboard, metrics like NPS, refund rates, and product reviews become more accessible for departments involved in the customer experience.
Thus, when satisfaction levels drop, for example, the customer service team can quickly investigate the cause and implement improvements before the brand’s reputation is affected.

7. Data-Driven Culture at All Levels of the Company
From the CEO to the traffic manager, every employee has access to personalized e-commerce dashboards with the metrics that matter most for their role.
This democratization of data fosters a data-driven culture, reduces opinion-based discussions, and accelerates project approval, as everyone tracks goals and results in real time.
8. Revenue Predictability and Financial Planning
With an e-commerce dashboard, it’s also possible to analyze seasonality and create demand forecasting models that provide realistic estimates of future revenue.
As a result, financial management can decide when to raise funds, accelerate payments, negotiate deadlines, or invest in new channels with calculated risk, avoiding cash flow surprises at the end of the month.

9. Alignment and Collaboration Between Teams
By visualizing the dashboard with the most relevant e-commerce KPIs, marketing, sales, logistics, and customer service teams can maintain alignment and collaboration in their daily routines.
This minimizes internal conflicts, reduces rework within campaigns, and makes meetings more objective.
10. Sustainable E-commerce Growth
Finally, by standardizing indicators and automating integrations, the online dashboard helps create a robust organization that facilitates sustainable e-commerce growth.
In other words, even as operational complexity increases over time, data governance, metric consistency, and the quality of analysis will remain intact.
Generate E-commerce Dashboards with Reportei
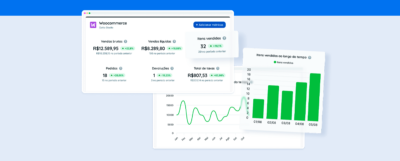
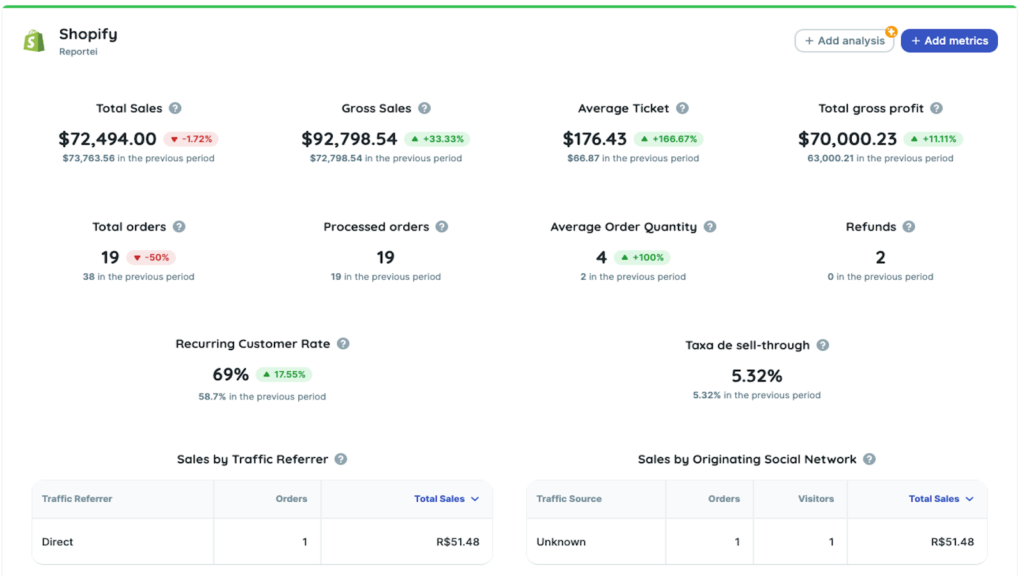
If you understand the importance of an e-commerce dashboard and are looking for a reliable option to monitor data from platforms like WooCommerce, Shopify, and Nuvemshop, it’s worth checking out Reportei.
Our marketing and sales analysis tool was created to turn metrics into actionable decisions without requiring advanced technical knowledge to build your dashboard.
Below are the key differentiators of the tool, which is perfect for those seeking an efficient e-commerce dashboard:
- Identification of Key Metrics: Choose pre-set KPIs or create custom metrics aligned with your business goals to build your dashboard.
- Data Consolidation from Multiple Sources: Integrate e-commerce platform data with Google Analytics 4, Meta Ads, Google Ads, and more than 20 other marketing and sales channels.
- Real-Time Data Visualization: This enables quick identification of trends, opportunities, or unexpected events that could affect actions.
- Customization and Segmentation: Build different dashboards to track paid traffic campaigns, social media, and sales. This way, each team member can monitor only what truly matters to their day-to-day tasks.
Want to see it in practice? Try Reportei for free for 3 days and see how an e-commerce dashboard can take your store’s performance to the next level!