Reports and Dashboards for Hotmart
Generate Hotmart reports and dashboards in just a few clicks with Reportei
Companies that trust Reportei


Hotmart reports and dashboards in 3 seconds with Reportei
By integrating your Hotmart account with Reportei, you can generate Hotmart reports and dashboards in just a few seconds and access key metrics and performance charts.
In a single screen, you can analyze Hotmart metrics alongside various other channels integrated with Reportei, making it much more convenient to extract insights and make your planning and investments more efficient.
Generate Hotmart reports and dashboards in just a few clicks
See how easy it is to stay informed about your Hotmart results? Start generating Hotmart reports and dashboards right away and take advantage of the opportunity to make your sales strategy much more effective.

Stay informed about Hotmart metrics
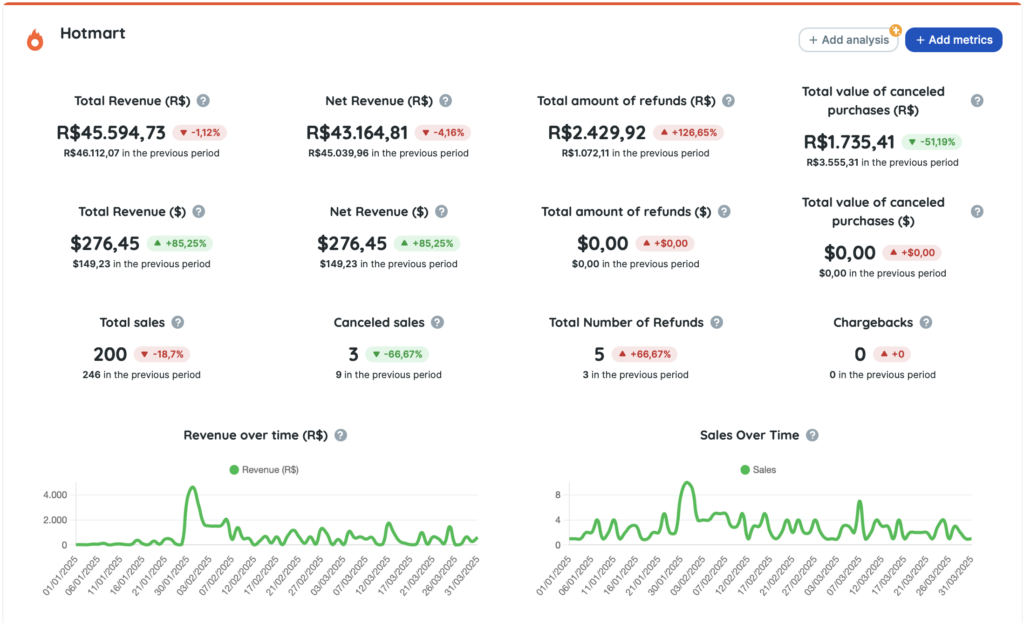
The Hotmart report and dashboard in Reportei gather all your sales results in one place, making it easier for both analysis and communication of this information with all team members
Final revenue
Total revenue
Number of sales
Number of canceled sales
Number of refunds
Number of chargebacks
Value of chargebacks
Revenue over time chart
Revenue table by product
And even more!
Just like in other Reportei reports, there’s also an option to conduct analysis using charts and tables. Here are some of them:
- Revenue over time chart, showing the revenue’s evolution during the period. It includes approved and completed sales, without excluding the value of chargebacks and refunds;
- Sales evolution chart during the period;
- Revenue table by product, summarizing product performance regarding sales, percentage of sales, revenue, and percentage of revenue.
Hotmart reports: present data in a more practical way
Present in the day-to-day of over 10,000 agencies, freelancers, and companies, Reportei allows you to generate unlimited, professional, and customized reports to facilitate result communication with your clients.
That’s why our Hotmart report includes the most important information to demonstrate whether your strategy was successful or not, and what actions will be planned to achieve even better performance in the future.
To reflect the data objectively and completely didactically, you have some resources that adapt perfectly to your reality and that of your client, as described below:


Your benefits
- Add, remove, or rearrange metrics according to what is most relevant for the project and decision-maker;
- Add one or more analyses (with texts, videos, and photos) to each report topic if you want to interpret the data and explain any result in more detail;
- Create a Timeline to visually showcase the actions performed at each stage of a specific campaign and the achieved returns;
- Download the report in PDF version;
- Send the report to the client through a link;
- Send the report through WhatsApp.
In addition to Hotmart reports, you can also generate reports for Instagram and Instagram Ads, Facebook and Facebook Ads, Google Analytics, Google Ads, YouTube, LinkedIn and LinkedIn Ads, Google Search Console, Google My Business, Mailchimp, and RD Station. Find the ideal plan for your projects and generate comprehensive, personalized, and objective reports for your clients!