Threads Reports and Dashboards
Reportei now also generates valuable insights for Threads! With our reports and dashboards, you can track the performance of your content, mentions, and reposts in a practical way, analyzing the results to optimize your strategy.
Companies that trust Reportei


Track Your Threads Results Simply and Quickly with Reportei!
Threads, one of the fastest-growing content platforms, is now integrated with Reportei!
Created to facilitate communication and boost authentic interactions, Threads has become an essential channel for brands and creators looking to strengthen engagement with their audience. And to optimize this strategy, tracking performance data is key.
With Reportei, you no longer have to waste time collecting this information manually. In just seconds, our Threads reports and dashboards gather essential metrics such as mentions, reposts, and views, all in an intuitive and customized way to fit your needs.
This way, you can focus on what truly matters: enhancing your strategies and aligning goals with your team or clients.
Discover all the benefits of our Threads report and dashboard now and take your analysis to the next level!
Generate Threads reports and dashboards in just a few clicks
See how easy it is to track performance on Threads? Generate your Threads reports and dashboards now and check out all the insights Reportei has for you!
The metrics you’ll find in the Threads report and dashboard
The Threads report and dashboard in Reportei gather all the results from your profile in one place, making it easier to analyze performance and communicate these insights with your team or clients.
Mentions
Mentions in posts
Shares in posts
Likes
Likes on posts
Number of followers
Reposts
Reposts in posts
Replies
Replies on posts
Views
Views in posts
Table
Cities with the highest number of followers
Table
Countries with the highest number of followers
Table
Featured posts
Chart
Audience by age and gender
Chart
Followers by gender
Chart
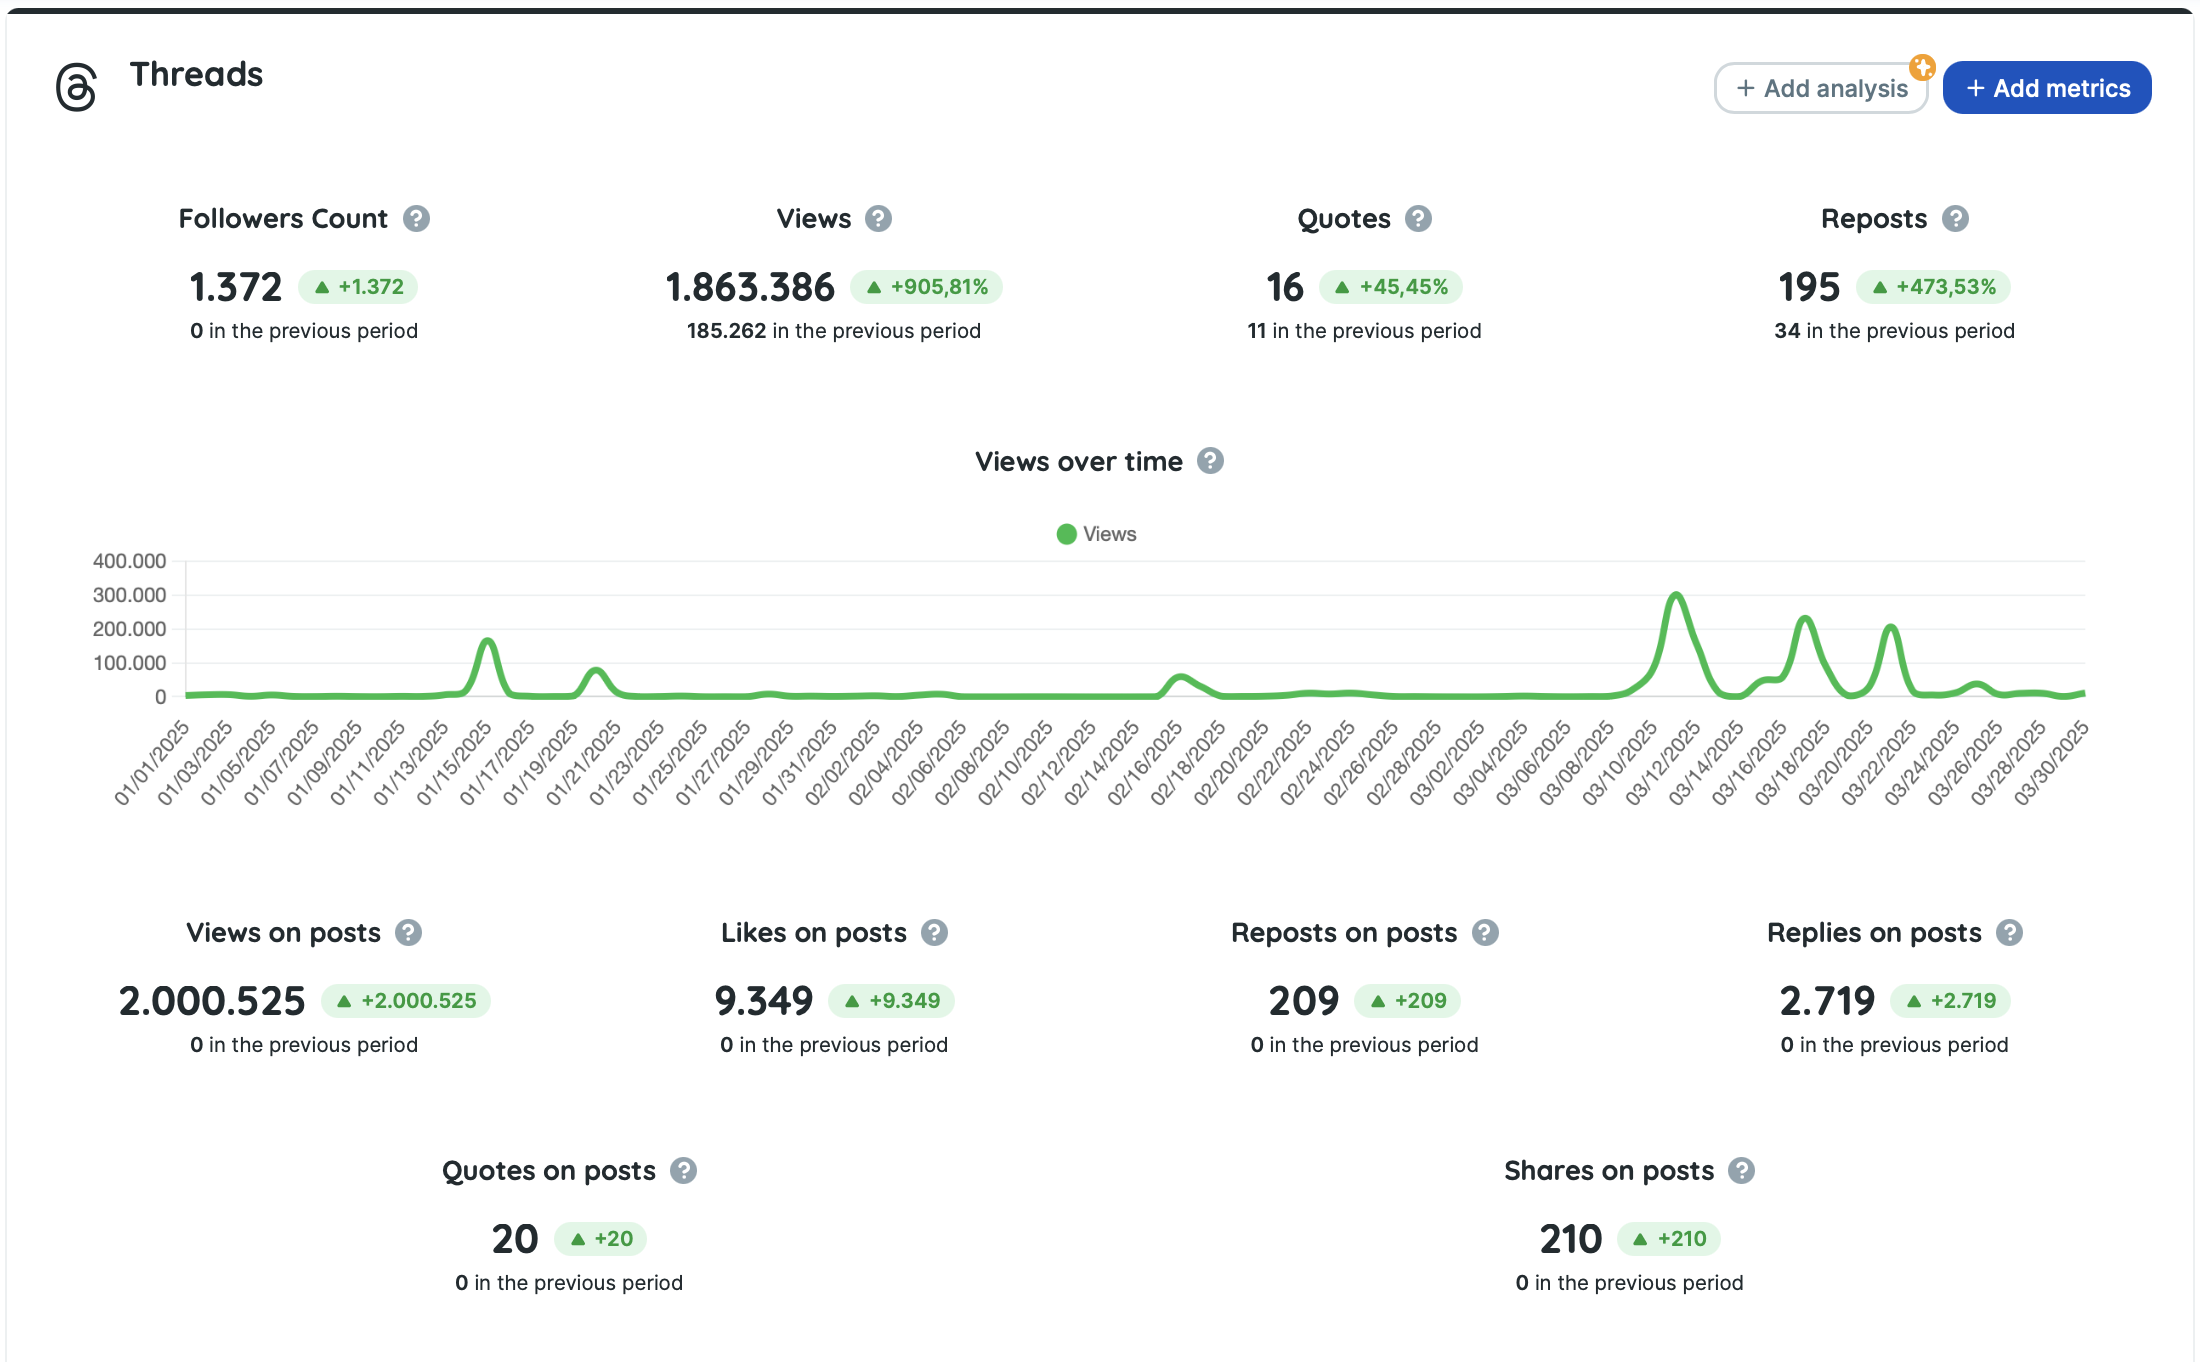
Views over time


Complete and unlimited reports and dashboards with Reportei
Our report and dashboard for Threads also feature tables that gather key metrics, such as highlighted posts and cities with the highest number of followers, allowing you to assess your profile’s performance with greater accuracy.
To complement your analysis, we offer two essential comparative charts: one for views over time and another for audience by age and gender – helping you understand the best times to engage with your audience.
Don’t waste any more time! Use Reportei to generate automatic reports and dashboards for Threads with much more speed, convenience, and accuracy.
Threads Reports: Present data to your client in a more practical way
Present in the daily routine of over 10,000 agencies, freelancers, traffic managers, and businesses, Reportei allows you to generate unlimited, professional, and personalized reports to make communicating results with your clients easier.
That’s why our Threads report contains the most important information to demonstrate whether your strategy was successful or not, and which actions will be planned to achieve even better performance in the future.
To present the data in an objective and fully instructional way, you have access to features that perfectly adapt to your reality and your client’s, as described below:


Its benefits
- Add, remove, or reorder metrics according to what is most relevant for the project and the decision-maker;
- Add one or more analyses (with texts, videos, and photos) to each report section if you want to interpret the data and explain a result in more detail;
- Create a Timeline to visually display the actions taken at each stage of a specific campaign and the results achieved;
- Download the report in PDF format;
- Send the report to the client via a link;
- Send the report via WhatsApp.
In addition to Threads reports, you can also generate reports for Instagram, Facebook, Meta Ads, Google Analytics 4, Google Ads, YouTube, LinkedIn, LinkedIn Ads, Google Search Console, Google My Business, RD Station, and much more. Find the ideal plan for your projects and generate complete, customized, and objective reports for your clients!