Find out what it is, how it works, and the main benefits of integrating Google Sheets with Reportei.
Without a doubt, Google Sheets is one of the most used tools in the daily life of those who work with marketing, sales, and data management.
After all, whether to control results, track goals, or organize information, spreadsheets become a central point of operation for any company.
However, the challenge arises when this data becomes isolated and difficult to analyze together with the numbers from campaigns and digital channels.
It is precisely to solve this scenario that Reportei now features the integration with Google Sheets. With it, it is possible to transform loose information into visual metrics, professional reports, and complete dashboards.
Below, understand how this new feature works and how to use your spreadsheets as a real database for your reports in Reportei.
What is the Reportei Google Sheets integration?
The new integration with Google Sheets has arrived to allow the import of data directly from your spreadsheets into the reports and dashboards automatically generated by Reportei.
In practice, this significantly expands users’ analysis possibilities.
After all, not all relevant business data is available in Reportei’s native integrations, such as some sales metrics, financial control, internal goals, or even manual records of offline results.
But now with the integration, Google Sheets acts as a flexible database that communicates directly with Reportei.
Thus, it becomes easier to present everything in a single report with professional visual context and much more clarity for those analyzing.
In other words, this is a particularly useful solution for agencies, traffic managers, marketing teams, and businesses that need to consolidate data from different sources without relying on manual processes.
Benefits of integration with Google Sheets
Thus, we can see that the main gain from this integration is freedom.
This is because instead of adjusting your analysis to what the tools automatically deliver, you tailor the report to the specific needs of your business.
See below the main benefits in practice.
- More flexibility to bring any data to Reportei, as long as it exists in a Google Sheets spreadsheet. This includes numbers, dates, monetary values, texts, and customized indicators.
- It is possible to import information about sales, leads, goals, budgets, commissions, CRM data, offline results, and much more. With this, everything is centralized in one environment.;
- Combination with other integrations like Google Ads, Meta Ads, social networks, SEO, and other Reportei integrations, facilitating the reading of the funnel as a whole.
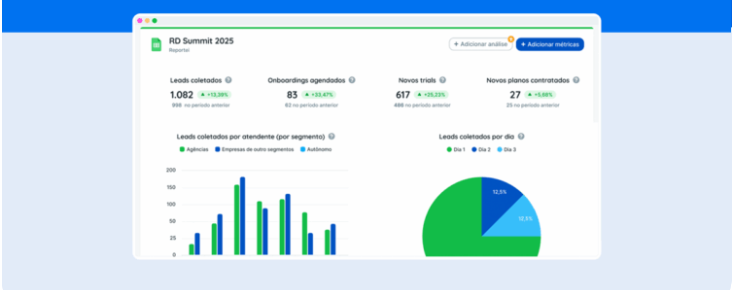
- Transformation of data into visual metrics as extensive and difficult-to-interpret spreadsheets give way to clear charts, tables, and indicators that facilitate presentations and decision-making.
Thus, it becomes much simpler to create more efficient reports and dashboards for each type of business with more complete and precise analyses.
How to create reports from the integration with Sheets
Without a doubt, one of the biggest advantages of this feature is its simplicity, as even those who have never explored the Google Sheets API or lack technical familiarity can use the integration without difficulties.
See the step-by-step guide below.
1. Connect your Google account the first step is to authorize the connection of your Google account with Reportei. After permission, you choose which spreadsheet will be used as the data source and the format, whether vertical or horizontal.
2. Map the spreadsheet columns here you must validate each type of data, such as number, text, date, or currency, and ensure that Reportei interprets the information correctly.
Indeed, this care makes all the difference to avoid errors and ensure that metrics are calculated accurately.
3. Create metrics, charts, or tables with the imported data, Reportei itself automatically suggests metrics based on the spreadsheet structure.
Even so, you can create customized metrics by combining columns and applying filters according to your strategy. This step is essential to transform raw data into truly useful information.
4. Generate a report or dashboard finally, just add the created metrics to your report or dashboard.
They now coexist with data from other integrations, offering a complete and integrated view of the results.
How to make the most of the integration in daily life
Besides being easy to perform, the integration with Google Sheets also offers great versatility for users’ routines since each team can use spreadsheets differently, and Reportei adapts to that.
Some practical examples of use include:
- Results of offline strategies such as actions at events, fairs, local partnerships, or campaigns outside the digital environment.
- Sales not going through a CRM many companies still record sales manually in spreadsheets. Thus, the integration allows analyzing these data along with digital channels.
- Costs and return from partnerships with influencers investments, generated sales, coupons, and influencer ROI can be controlled in Sheets and clearly visualized in Reportei.
- Results coming from channels like WhatsApp conversions originated from manual service or negotiations on WhatsApp can be registered in the spreadsheet and analyzed alongside other sources.
In the end, the integration helps to see the real impact of strategies, including those that were previously outside the analysis.
Test the new integration right now.
If Google Sheets is already part of your routine, integration with Reportei is a natural step to evolve your data analysis.
After all, it reduces rework, eliminates parallel controls, and transforms spreadsheets into clear, visual, and professional reports..
Therefore, it’s worth trying the integration right now and seeing how it’s possible to centralize all your marketing information in one place with much more context and security for decision-making.
Try Reportei for free and enjoy the possibilities!
FAQ: Frequent questions about the Reportei integration with Google Sheets
Before starting to use the integration, it’s normal for some questions to arise. Below, we gather the most common questions to facilitate understanding.
Google Sheets is an online spreadsheet tool. In the integration with Reportei, it functions as a personalized data source for the reports.
No. All the connection is done visually and guided within your Reportei account without the need for technical knowledge or API setup.
Numbers, texts, dates, monetary values, and any information structured in columns.
Yes. This is one of the great differentials of the integration, allowing for more complete analyses.
No. It can be used for goals, costs, leads, offline results, partnerships, and internal controls.
Yes. Even those who are starting can use the integration simply and intuitively.