
Kwai Ads Reports and Dashboards
Track your campaign results with Kwai Ads reports and dashboards on Reportei
Companies that trust Reportei












Stop wasting time!
With Kwai Ads reports and dashboards integrated into Reportei, your team develops comprehensive analyses and uses this data to plan more effective actions in paid media strategies.
You also have access to a range of features that make communication with your client much clearer and more professional, such as: template customization for reports and dashboards, with AI-powered analysis; inclusion of text, video, and image analyses to complement data with your strategic perspective; and the creation of a Timeline, which chronologically organizes all planned and executed actions.
For a complete view of your operations, you can track essential metrics such as: amount spent, impressions, clicks, CTR, conversions, and cost per conversion; as well as indicators like action rate and cost per action, which help deepen your analysis of results.
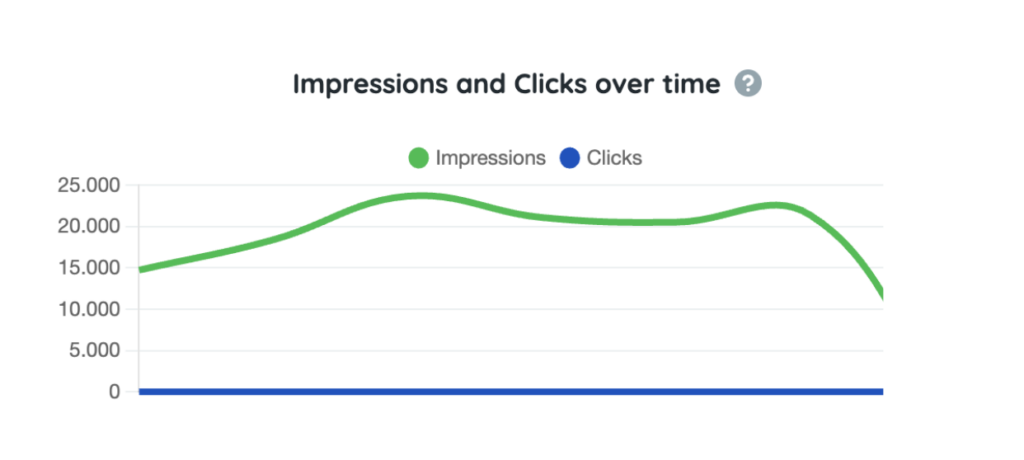
You also have access to strategic visualizations through tables and charts, such as top campaigns, top creatives, and top ad groups — making it easier to identify patterns and optimization opportunities. And with charts showing conversions over time, spend over time, and impressions and clicks over time, tracking campaign performance becomes even simpler.
In other words, you have everything you need to create reports and dashboards that support both the evolution of your Kwai campaign performance and strategic alignment with your clients.
Generate Kwai Ads reports and dashboards in just a few clicks
Start generating Kwai Ads reports and dashboards right now and bring all your results together automatically and with much greater ease.
What metrics can I analyze in the Kwai Ads report and dashboard?
The Kwai Ads report and dashboard includes the most important metrics for evaluating the performance of your paid media campaigns. Among them: amount spent, clicks, and conversions.
Actions
Campaigns
Clicks
Comments
Shares
Conversions
Deep Conversions
CPM
CTR (Click-Through Rate)
Likes
Cost per Action
Cost per Conversion
Cost per Deep Conversion
Impressions
Asset Impressions
3s Video Views
Campaign Summary
Followers
Action Rate
Completion Rate
Conversion Rate
Deep Conversion Rate
3s Play Rate
5s Play Rate
Amount Spent
Table
Top Campaigns
Table
Top Creatives
Table
Top Ad Groups
Table
Audience by Gender
Table
Audience by Age
Chart
Conversions Over Time
Chart
Spend Over Time
Chart
Impressions and Clicks Over Time
An exclusive report and dashboard from Reportei!
By integrating your Kwai Ads account with our tool, you can import all data quickly (in just three seconds) and align results with those from other social media platforms and ad networks.
You can analyze performance from top-of-funnel actions all the way through to customer conversion!
This means you gain more efficiency in your day-to-day work and save time to focus on what really matters: the product or service you deliver.
On the other side, you can build even stronger relationships with your clients or decision-makers, helping them understand not just the final result, but also the entire process behind it and the next steps ahead.
What are you waiting for? Use Reportei to generate Kwai Ads reports and dashboards. Also generate other digital marketing reports and dashboards and social media reports and dashboards that are part of your strategy.
Kwai Ads Reports: present data to your clients in a more practical way
Used daily by more than 10,000 agencies, freelancers, franchises, traffic managers, and companies, Reportei allows you to generate unlimited, professional, and customized reports to make communicating results with your clients easier.
Our Kwai Ads report includes the most important information to show whether your strategy was a success and what actions will be planned to achieve even better performance in the future.
To present data in an objective and fully accessible way, you have access to features that adapt perfectly to your reality and your client’s, as described below:


Your benefits
- Add, remove, or reorder metrics according to what is most relevant to the project and the decision-maker;
- Add one or more analyses (with text, videos, and photos) to each section of the report, to interpret the data and explain results in more detail;
- Create a Timeline to visually present which actions were taken at each stage of a given campaign and what returns were achieved;
- Download the report as a PDF;
- Share the report with your client via a link;
- Send the report via WhatsApp.
In addition to Kwai Ads reports, you can also generate reports for Instagram and Instagram Ads, Facebook and Facebook Ads, Google Analytics, Google Ads, YouTube, LinkedIn and LinkedIn Ads, Google Search Console, Google Business Profile, Mailchimp, ActiveCampaign, WooCommerce, Shopify, and RD Station. Find the ideal plan for your projects and generate complete, customized, and objective reports for your clients!