NAMTAB Reports and Dashboards
Track the results of your task management, timesheet, and sales pipeline strategy with Reportei’s NAMTAB reports and dashboards
More than 10,000 companies trust Reportei every month












Stop wasting time!
With the NAMTAB report and dashboard integrated into Reportei, your team builds complete analyses and uses that data to plan more effective actions for future projects.
On top of that, you get a series of important features that make communication with your client even clearer and more practical, such as: customizable templates for your reports and dashboards, adding or removing metrics according to what is essential for your project; added analyses (in text, videos, and photos) to complement the information with your own view of the results; a Timeline that tells, in chronological order, each stage planned and carried out in your strategy.
In other words, you have all the tools you need to create reports and dashboards that help both with improving your strategy and with aligning objectives with your clients!
Generate NAMTAB reports and dashboards in just a few clicks
Start generating NAMTAB reports and dashboards right now and gather your results automatically and much more easily.
Which metrics can I analyze in the NAMTAB report and dashboard?
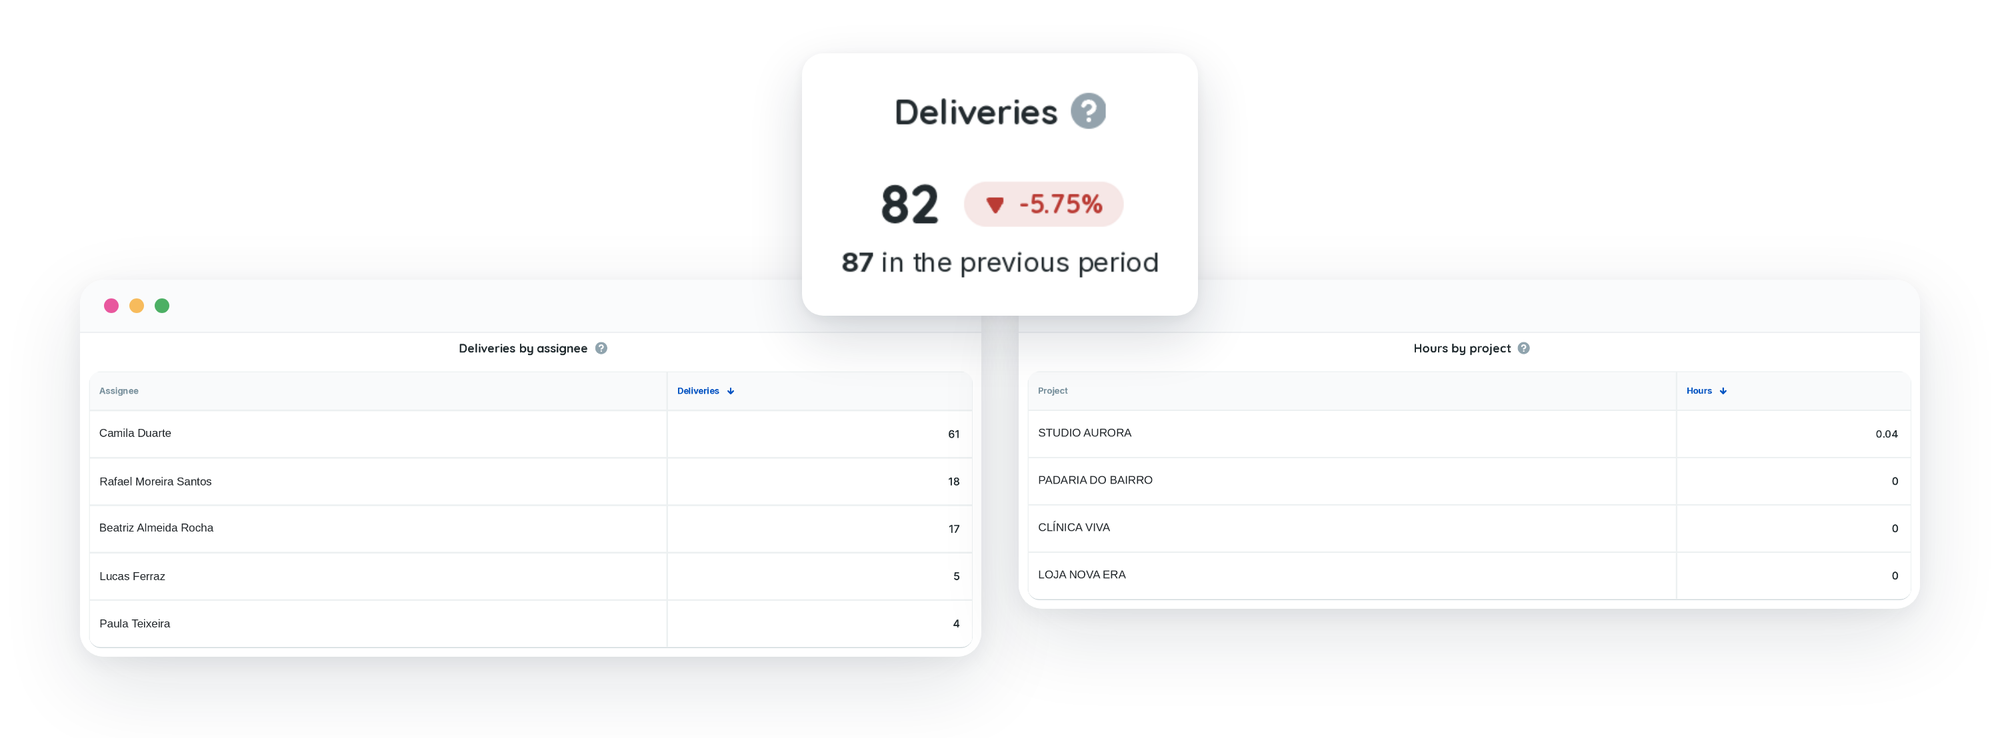
The NAMTAB report and dashboard includes the main metrics to track your company’s project and sales operations. They are tasks, timesheet, and sales pipeline metrics:
Deliveries
Tasks created
Hours logged
Deals created
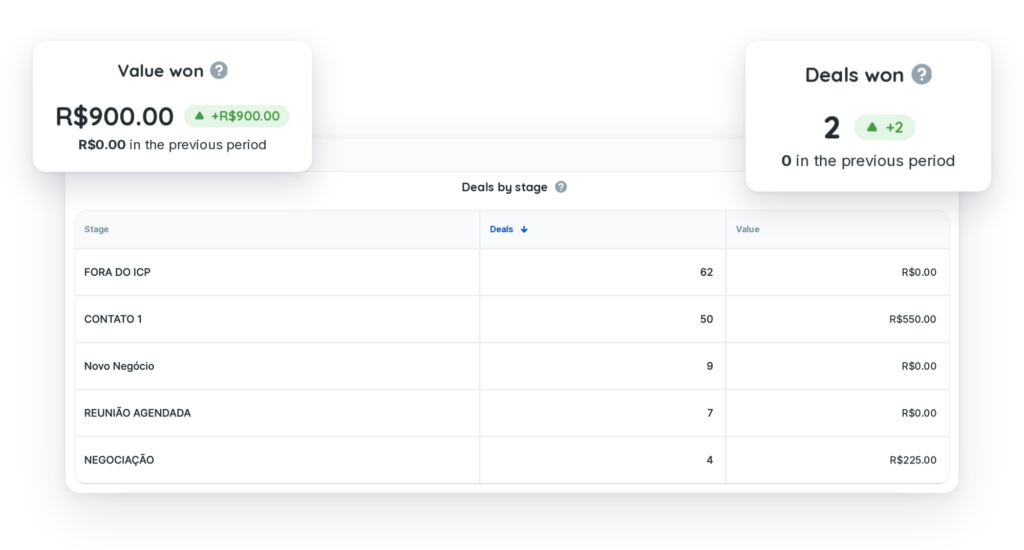
Deals won
Value won
Table
Deliveries by project
Table
Deliveries by assignee
Table
Hours by project
Table
Hours by member
Table
Deals by stage
Table
Deals by pipeline
A report and dashboard exclusive to Reportei!
By integrating your NAMTAB account with our tool, you can import all your data quickly (in just three seconds) and align the results with those of other social media.
NAMTAB metrics cover three fronts of the operation. In tasks, you track the deliveries completed in the period and the tasks created, broken down by project and by assignee. In timesheet, you see the hours logged by project and by member. In the sales pipeline, you track the deals created, the deals won, and the value won, with the breakdown by stage and by pipeline.
That way you come out ahead, because you get more practicality in your day-to-day and time savings that let you focus on what really matters: the product or service you deliver.
On the other end, it is possible to build even closer relationships with the clients/decision-makers of your agency or company, so they understand not only the final result, but also the whole process that led to this moment and the next steps for the future.
What are you waiting for? Use Reportei to generate NAMTAB reports and dashboards. Also generate other digital marketing reports and dashboards and social media reports and dashboards that are part of your strategy.
NAMTAB Reports: present data to your client in a more practical way
Part of the daily routine of more than 8000 agencies, freelancers, traffic managers, and companies, Reportei lets you generate unlimited, professional, and customized reports to make communicating results with your clients easier.
That is why our NAMTAB report has the most important information to show whether your strategy was a success or not, and which actions will be planned to get even better performance in the future.