Analyze your sales with precision using our Pipedrive report
When it comes to managing sales and a productive sales team, Pipedrive is one of the most popular CRMs (Customer Relationship Management) on the market today.
But beyond using the platform for planning activities and tasks and managing potential deals, you can and should take advantage of the data on results to develop your sales more strategically.
You can now find Pipedrive reports in Reportei as well! You can capture data quicker and more efficiently. They’ll also help you analyze data from your channels, contributing to a high-performing funnel. Get the inside scoop below!
Pipedrive metrics on Reportei
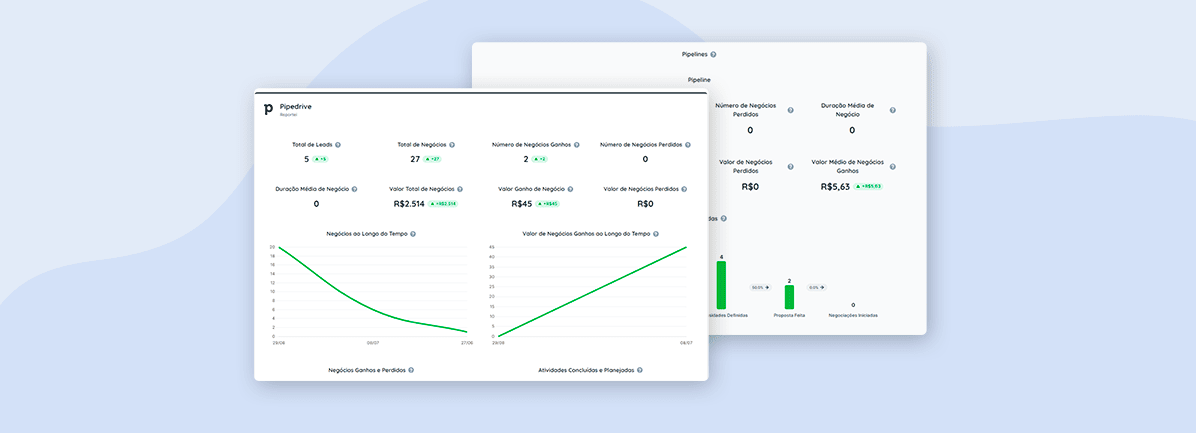
Number of account leads during the analysis period;
Number of trades registered in the account;
Number of won trades (sales closed during a particular period);
Number of lost trades;
Average trade time in days;
Value of trades within a period, in reals;
Value of won trades during a given period;
Value of lost trades.
After giving you this overview of results, our Pipedrive report hands you details on the activities carried out within a period, such as:
Scheduled activities for a determined period (calls, meetings, emails, tasks, deadlines, or lunch);
Activities carried out;
Scheduled tasks;
Tasks completed in the period;
Scheduled meetings;
Number of meetings carried out;
Scheduled calls;
Calls made.
Use graphs and tables for your analysis
Besides the metrics listed above, our new Pipedrive reports also feature four comparative charts to help you analyze your sales:
- Evolution of closed trades over time;
- Value of closed trades over the period;
- Relationship between won and lost trades;
- Relationship between completed and planned activities.
Along with that data, we developed a performance per user table with the activities, sales, gains, and losses of each member of your commercial team.
Generate Pipeline reports (sales funnel)
Did you think that was all? It’s definitely not! Our reports give you an overview of your account, which helps with analysis. But you also get specific data for each Pipeline.
So, you can access metrics and conversion rates in each section of the sales funnel, from lead entry and qualification to winning or losing trades.
Customize your Pipedrive reports
As we mentioned before, one of the advantages of our Pipedrive report is that you can customize it to suit your needs.
Our tool lets you add your analysis in text, image, and video formats to complement metrics automatically. You can also add, remove, or reorder metrics and more.
And in case you find any relevant data missing, you can add it through manual metrics and graphs and create a template that can be saved and reused anytime.
Another benefit of customized reports is that you get to choose how to order your channels. You can create inverted funnels to explain results at each section to your decision-maker.