Microsoft Ads Reports and Dashboards
Track the performance of your campaigns with Microsoft Ads reports and dashboards from Reportei
Companies that trust Reportei


Stop wasting time!
The results of your advertising campaigns have a lot to say about the future of your project and your client’s business! Through our Microsoft Ads report and dashboard (formerly Bing Ads), you gain access to the key metrics that highlight the performance not only of your campaigns, but also of the ad groups and keywords defined for them.
In both a general and specific way, you can understand and demonstrate how this investment is important for the growth of the companies you serve, as well as identify improvements to make it even more effective.
Explore the details of Microsoft Ads reports and dashboards generated in Reportei and discover how we can support your paid media strategies and client relationships!
Generate Microsoft Ads reports and dashboards in just a few clicks
See how easy it is to stay on top of your Microsoft Ads results? Generate your Microsoft Ads reports and dashboards now and explore all the details Reportei has to offer!
Use metrics as inputs for the next stages of your project
When generating a Microsoft Ads report and dashboard, you can import essential information from ad campaigns that ran during a specific month or time period.
The best part is that these analyzed campaigns can be either recent or retrieved from years ago, depending on the data stored by Microsoft in your account.
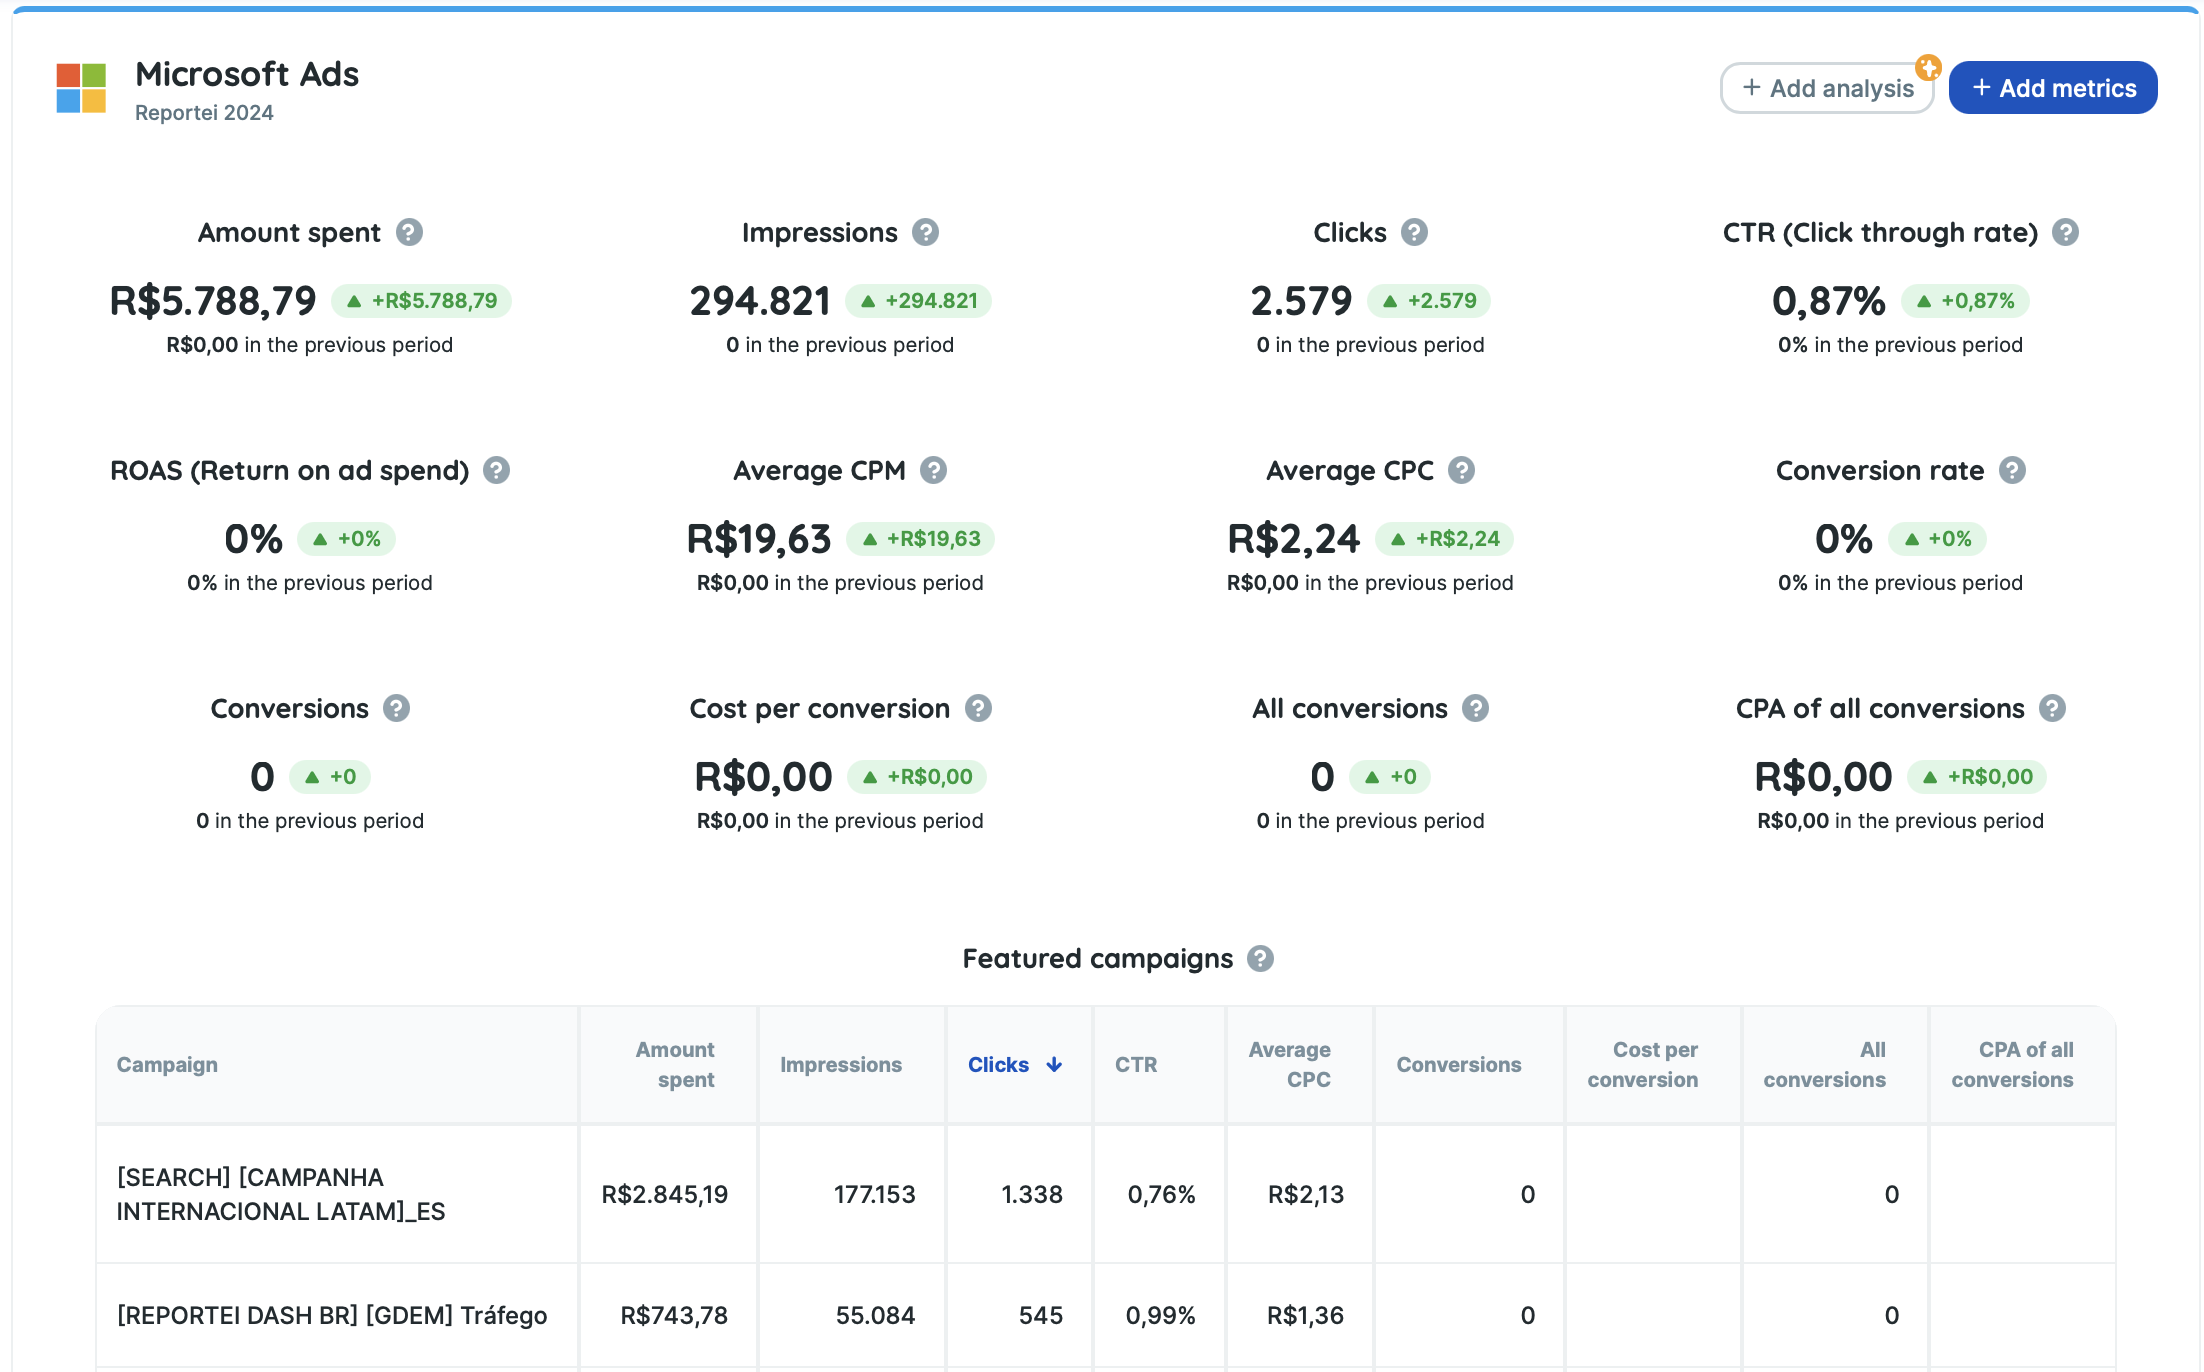
In just three seconds, you can view the following metrics:
Impressions
Clicks
Spend (currency)
Conversions
All conversions
Cost per all conversions (currency)
All conversion rate (percentage)
All conversion revenue (currency)
All conversion ROAS (percentage)
Conversion value (currency)
Revenue (currency)
CTR — Click-through rate (percentage)
Average CPC (currency)
Average CPM (currency)
Conversion rate (percentage)
Cost per conversion (currency)
ROAS — Return on ad spend (percentage)
Quality Score
Impression Share (percentage)
Top impression rate (percentage)
And much more!
The main data shown above is also available in comparative charts that display how these metrics evolved over time. These include: Impressions and Clicks, Clicks and CTR, Conversions, as well as Spend and Average CPC, allowing for a complete campaign performance analysis.
Reportei’s report and dashboard go even further by presenting ad access data through device-based charts, such as Clicks, Impressions, and Spend by device, highlighting whether interactions occurred via desktop, mobile, or tablet.
Analyze your campaigns and ad groups separately
In addition to having an overall view of your campaigns, our Microsoft Ads report and dashboard allow you to access specific data for each campaign and the ad groups created for your clients.
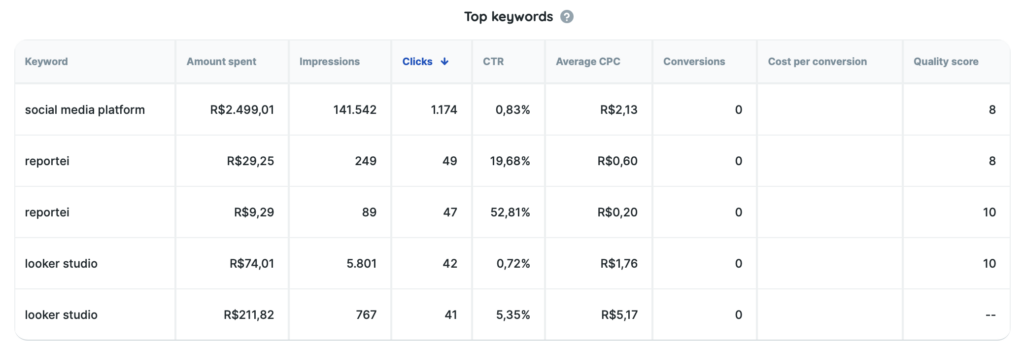
Key metrics are organized into strategic tables, such as Featured Campaigns, Ad Groups, Top Keywords, Featured Ads, as well as geographic and device performance analyses.
This gives you a detailed view of what is truly performing well, what needs optimization, and which keywords, audiences, and segments generate the most clicks, conversions, and return for your business.
Join the Reportei team and analyze your Ads campaign results in just a few clicks, with much more efficiency.
Generate reports and dashboards that simplify communication with your client
With Reportei’s report and dashboard, you can present a fully customized analysis tailored to your client’s interests.
Among the features available in Reportei’s digital marketing and social media reports and dashboards, you will find:
- The creation of templates with the metrics you consider most important for your project, which can be reused across different reports and clients;
- Comparison with past data from any previous time period;
- The addition of insights and analysis (in text, images, or video) to complement the data with your interpretation of what happened during that period.
All of this was designed not only to report information, but also to drive engagement and foster closer communication with clients and decision-makers.
Start generating reports and dashboards now and transform your team’s workflow and the digital marketing projects you manage!
Microsoft Ads Reports: present data to your client in a more practical way
Used daily by more than 10,000 agencies, freelancers, media buyers, and companies, Reportei allows you to generate unlimited, professional, and customized reports to improve communication of results with your clients.
That’s why our Microsoft Ads report includes the most important information to demonstrate whether your strategy was successful and what actions should be planned to achieve even better performance in the future.
To present data clearly and effectively, you have access to features that adapt perfectly to your reality and your client’s needs, such as:


Your benefits
- Add, remove, or reorder metrics according to what is most relevant for the project and the decision-maker;
- Add one or more analyses (with text, videos, and images) to each section of the report to interpret data and explain results in more detail;
- Create a Timeline to visually present which actions were carried out at each stage of a campaign and what results were achieved;
- Download the report as a PDF;
- Share the report with your client via a link;
- Send the report via WhatsApp.
In addition to Microsoft Ads reports, you can also generate reports for Instagram and Instagram Ads, Facebook and Facebook Ads, Google Analytics, Google Ads, YouTube, LinkedIn and LinkedIn Ads, Google Search Console, Google Business Profile, Mailchimp, and RD Station. Find the ideal plan for your projects and generate complete, customized, and objective reports for your clients!